The following layouts are a history of the changes I've made going back to December 2012. This page may take some time to load - I've made many layout changes over the years.
Current and more recent layouts are updated on my Sharpshorts Day Trading blog._________________________________________
Additional undated layouts
12/27/2017 -- 4 Session + Daily over 5 Tick charts

12/22/2017 -- 4 Session + Daily over 5 Tick charts

2 charts per monitor and my 'control panel' on M7


M1 M2 M3 M4 M5 M6

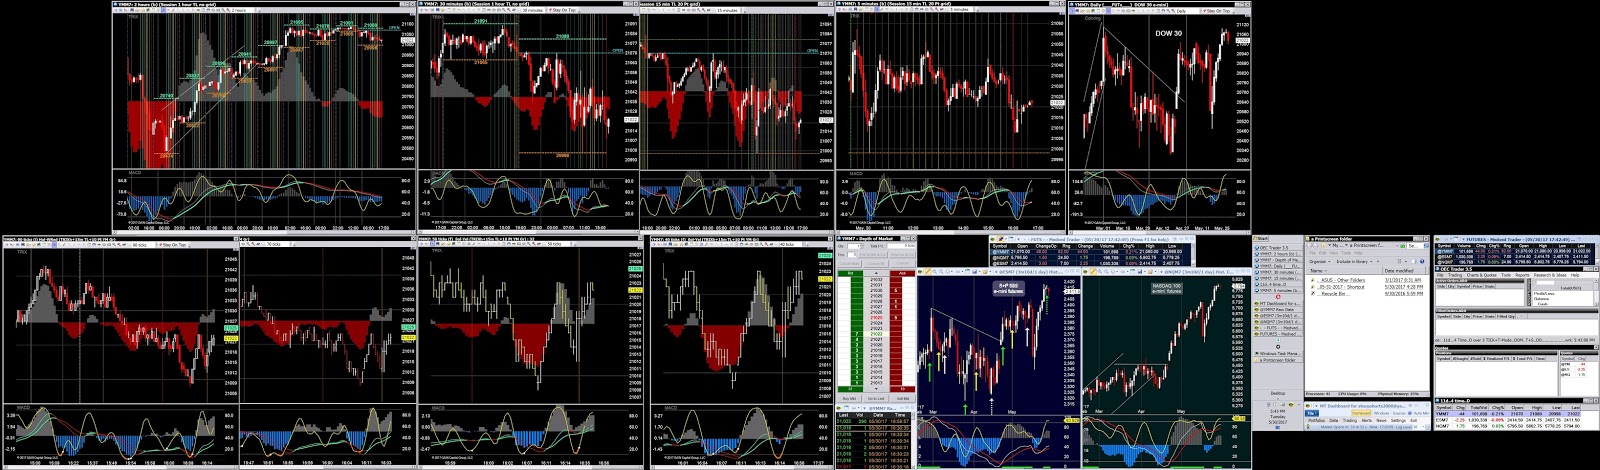
11/09/2017 -- 12 chart ... MT and APEX software running
ES, NQ and YM Dailies, two YM session charts (30m 2 session and 15m 1 session)
with two partial session tick charts
over four shorter session tick charts, a T-Mode trade chart, tick stream and DOM

11/16/2017 -- 12 chart ... MT and APEX alternative
4 tick and 2 time based over 2 T-Mode with T&S, Tick+DOM and 3 dailies

11/07/2017 -- 10 chart 6 monitor
Added 2 study templates and other minor changes to the previous layout.

11/01/2017 -- 10 chart 6 monitor
YM Daily+2 Session+2 Tick over ES+NQ Daily+2 Tick+T-Mode+DOM+T&S

10/03/2017 -- 8 chart 6 monitor
Daily NQ, ES and YM with 1 session chart over 4 Tick charts
(the main T-Mode chart is on the lower right)
Links to the individual monitor set ups - M 1 ... M 2 ... M 3 ... M4 ... M 5 ... M 6


Left and center are Tick based...right are dailies and a time based


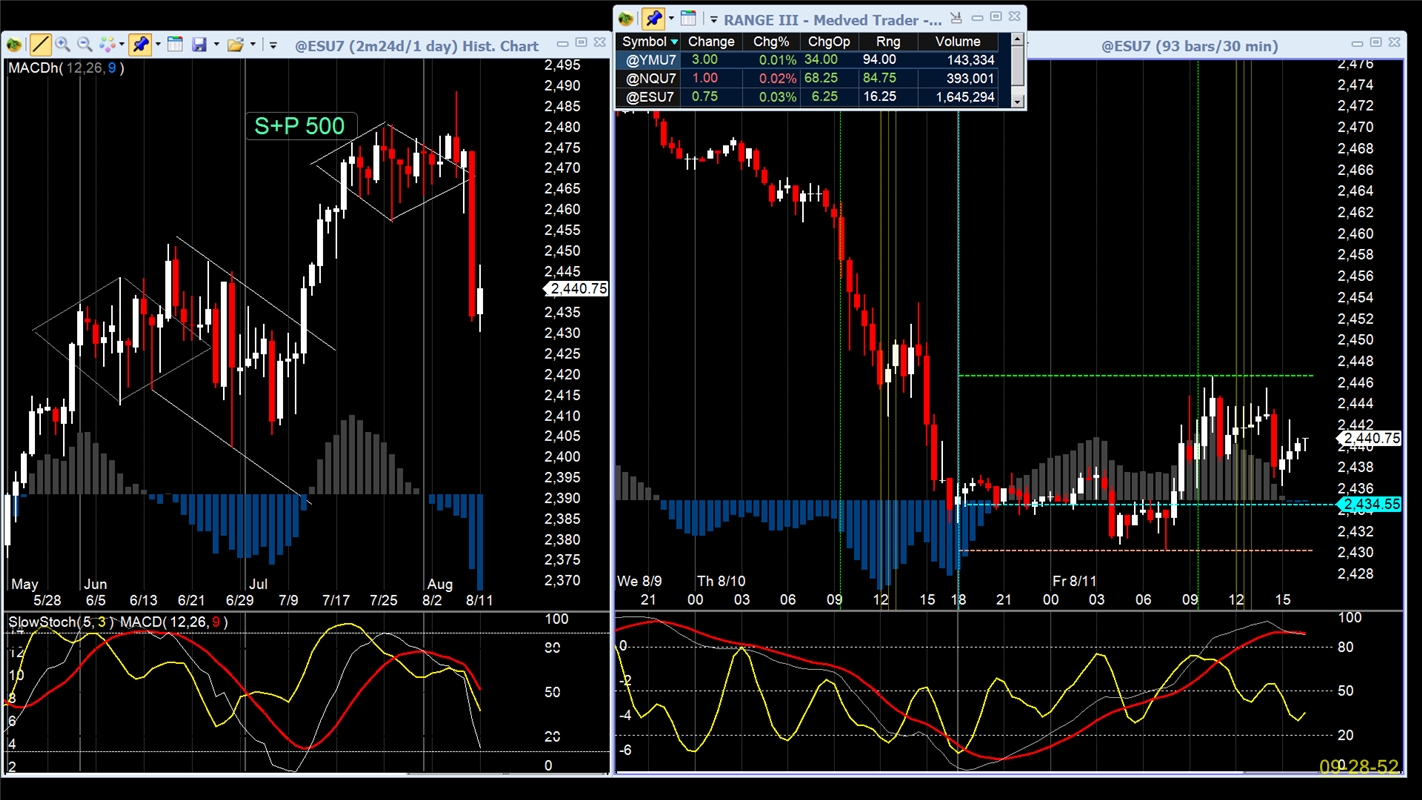
09/28/2017 - 10R layout
Daily YM with 3 Session charts, daily ES and daily NQ over 4 Tick charts (T-Mode on right)

09/04/2017 - 10 charts
Daily ES, Daily NQ and Daily YM with 3 Session charts over 4 Tick charts for either the YM or NQ
This layout is very similar to that of 08/29/2017 but eliminates the ES & NQ Session charts
and adds a linked 15 min & 5 min...

Daily & Session (YM, ES and NQ) over 4 Tick charts for either the YM or NQ


08/17/2017 - 12 charts, 2 markets (7 monitors)
Daily & Session (ES, YM and NQ) over 3 Tick charts (ea.) for the YM and NQ


08/13/2017 - 12 charts, 3 markets
A Daily & Session (1 ea.) over T-Mode for the ES, YM and NQ (2 ea.)


08/09/2017 - 9 charts total
Upper monitors: NQ, ES and YM Daily + Session charts.
Lower monitors: 3 T-Mode tick charts, DOM and T&S with add'l windows on M7

07/25/2017 - 11 charts total w new trade charts
Using 2 Medved Trader charts and 9 ApexTrader charts
Upper monitors: NQ, ES and YM Daily + Session charts.
Lower monitors: 5 tick charts on M4, M5 & M6 with add'l windows on M7
One-Two Punch chart templates: MACh w price, TRIXh w price and 2 study TRIX w price.


07/20/2017
Daily DJI, 5 time based session charts over 3 tick charts, DOM, T&S with daily ES & NQ

07/13/2017
3 time based session charts over 3 tick charts, DOM, T&S

05/23/2017
***ApexTrader + Medved Trader programs***
ES and NQ (MT) with YM Daily plus 3 time based over 3 tick, DOM, T&S and a 5 minute

4 tick charts, DOM, T&S with 2 MT dailies on the right.
Also showing monitor 7 with the 'Control Panel".
05/07/2017
***ApexTrader + Medved Trader programs combinations***
11 charts -- daily ES, YM and NQ plus session and tick charts of a selected symbol


A daily and 5 time based session charts (1-2 hours to 1-2 minutes per bar) are displayed
on the upper monitors over tick based charts, a T-Mode tick chart with a T&S and DOM.


of price activity gets displayed. Orders can also be controlled using the Depth-of-Market

04/19/2017 ... 3 markets
ES, YM, NQ...Each market has a daily and a time based session chart
over two tick based T-Mode charts with Time&Sales.

T-Mode ES on M4


04/14/2017... 2 markets


03/27/2017...Other markets
This layout has 12 charts in total for some of the other markets I look at :
Grains like CORN, Currencies like the British Pound, Bonds and SOFTs...
10 ApexTrader and 2 Medved Trader charts along with a couple of 'portfolio windows'.
The Medved software is on M3...Monitor 7 with the "control panel" is not shown

3/18/2017...10 chart 6 monitor
5 Time based (Apex Daily, 2 hr, 1 hr, 15 min and a 3 min Medved)
over 5 tick based (Apex 90T, 60 T, 45T, 35T and a 200T Medved)


12 chart 6 monitor
Monitor 3 has an MT chart and an APEX chart with 'dual' dailies (ES & NQ)

And another...M3 has a 5 minute and 2 1/2 minute with the 'dual' daily on M6.

9 chart 6 monitor
Upper monitors - Time based...7 ApexTrader charts and 2 Medved Trader (M3).
Lower monitors - Tick based with T-Mode enabled on 2 of them.

Slight modifications...

3/14/2017...11 chart 7 monitor
2 Medved Trader minute based charts are displayed on monitor 3
sharing the layout with 8 ApexTrader charts and the 'control panel'.
sharing the layout with 8 ApexTrader charts and the 'control panel'.


M2

M3 (Medved Trader)

M4

M5

M6

M7

3/3/2017...10 chart 7 monitor
Combining ApexTrader and Medved Trader software programs


02/27/2017... 12 chart setup
2 Medved daily charts, 1 ApexTrader daily and 3 intra-day session charts
over
6 tick charts with a Time &Sales and DOM...M7 control panel


02/24/2017...11 chart setup
2 MedvedTrader daily charts plus 9 ApexTrader charts

02/20/2017...10 chart setup
7 Screen Layout - 8 ApexTrader charts plus 2 MedvedTrader charts

02/12/2017
7 Screen Layout

M1 Showing five sessions and one session 
M2 Showing the major market open/close and about 2 hours


MT uses the same data feed as ApexTrader. Both software programs can be run simultaneously.


M7 Task-bar...On the left side, Snapshot folder over Filled orders and Active orders...
On the right, Positions, MT Dashboard over MT Quotes,

ES daily...YM daily...1 hr...15 min...5 min...1 min
over
NQ daily................60 T...45 T..35 T...T&S...DOM

over a Quote Window with Filled Orders and Active Order windows

I'm constantly redesigning my layouts. Lately I'm finding that fewer is better...
My basic chart template set up has remained the same for years.
M1...Time based M2...Tick based M3... Daily & control panel/task bar
M4...Tick based M5...2 tick T-Mode & Time+Sales M6...DOM
I use the left side of M3 for Picture Viewer and for add'l file folders.
I open Windows Paint and browsers on M6

11/24/2016... 2 market set up
YM over NQ tick charts and the 'Control Panel' on the
right with a linked daily over a linked session chart.

10/21/2016...Morning trade setup
Have been experiencing chart rendering lags by as much as 15 seconds
relative to system time, especially during the first hour of the MMO session.
Seems my 4 year old computer can no longer keep up with the amount of data being sent...
Other wise the windows update choppily - taking 2, 3 or many more seconds to render.

Having other windows open (like multiple browsers) do not show the "lag" as far as I can tell
and do not seem to have any additional adverse affect on the ApexTrader performance.
Afternoon trade setup
5 charts open (showing 4 monitors)


(showing 4+ monitors)

(showing 4+ monitors)

11/08/2016...9 charts
I'd like to be able to run this all the time (or the 10 chart layout below it) but during active times
there is too much delay in it's rendering...
Large tick and 3 session charts over 3 more tick charts with a T&S, a 30 minute and daily.

10/13/2016...(F) 10 charts - -
4 session with a daily over 3 tick T-Mode and 2 dailies

10/03/2016...Ca---4 Session over 3 tick
with 2 longer term time based and a Daily

M1 M2


M3 M4


09/28/2016... A---[series]
Over-laying smaller width charts on top of wider width allows for interesting perspectives.

09/24/2016
Cf---6 tick (TRIXMAC)
A daily with 3 time based charts over 6 tick based trade charts. Several of the chart windows
are docked and "Keep Bar Size" is ON for each pair...Adjusting the horizontal size of one chart
also changes the other while keeping the price bar size & spacing unchanged.

Cf---6 tick [2 market] (TRIXMAC)
I saved identical versions of the two market layout shown below. The four time based charts
on the upper screens work for any symbol...but because of the respective activity levels
for each of these 3 markets, they require different tick-per-bar settings for their trade charts.
These links show the lower screens for the [ES+YM] layout ES and YM T-Mode sets.
The [NQ+YM] layout has only minor ticks-per-bar chart differences.

09/24/2016 (D-----9 tick [3 market] ES+NQ+YM (TRIXMAC)

09/24/2016 (D1----9 tick [3 market] ES+NQ+YM (TRIXMAC)

09/20/2016 (Cc--TRIXMAC)
The main change is the combined DOM and T&S on the lower right monitor with the T-Mode charts.
. This layout has 4 time based charts over 5 tick based (a daily chart is minimised).

09/14/2016 (B--BASIC-f)


09/12/2016...B -- 2 MARKETS

09/03/2016...Wyckoff set up
Longer term charts of the majors - Weekly, Daily and large multi-session time based charts.

08/30/2016 (A--BASIC-a)
4 Time based session charts (1, 3, 15, 30 minute) and a linked daily
4 Tick based (45, 60, 90, 120 T)

09/01/2016 (A--BASIC-b)
Weekly, Daily, 1 min ,3 min, 15 mn, 30 min over tick charts.

08/23/2016 (A--BASIC) Series V
4 Time based session charts (1, 3, 15, 30 minute) and a linked daily
5 Tick based (40, 60, 90, 120 T)

08/12/2016 (A--BLINE)
5 Time based session charts (1, 3, 5, 15, 30 minute)
4 Tick based (40, 60, 80, 100 T) and a linked daily

08/07/2016 (C series with BLINE)
Three time based session charts and a daily over five tick charts and a time based...


08/04/2016 (F Series with BLINE)
Three time based session charts and a daily over five tick charts same as (K series).
The lower monitors have changed to include a new BLINE indicator on each chart.

The BLINE is based on a 6 period EMA of a 5 period TRIX (which is based on price).
The Lime diamonds print on the EMA line, highlighting its positive slope...I've created several
chart templates showing the BLINE in the price pane, in its own small study pane
and in with other indicators in a study pane. chart templates showing the BLINE in the price pane, in its own small study pane


07/28/2016 (K series)
Three time based session charts and a daily over five tick charts.
The LH lower monitor has a 30T T-Mode and 45T (docked in the same window)
followed by 60T, 90T and 240T charts for the longer term perspective.


07/27/2016 (P series)
Three time based session charts and a daily over six tick charts. The LH lower monitor has a 30T T-Mode
flanked by a small 60T and 90T, docked in the same window...This is the main order placement window
followed by larger 45T, 60T and 90T charts for the longer term perspective.

07/16/2016 (M series layout) For two markets at a time
The three upper left charts are 180/240/480T for the ES with it's higher ticks per bar.
The lower left are for YM or NQ since either symbol displays well with 45/60/90T settings.
The right hand charts are varying length time based sessions with a daily and are linked to Quotes.

07/23/2016 (O series layout)
3 Time based session charts and a daily over 6 Tick based...

07/10/2016 (L series layout)
Left to right, short to long term...Time based charts (1m,3m,5m,15m,30m) and daily
over 2 T-Mode tick charts, T&S, DOM, a longer term tick chart and a multi-day time based chart.

07/06/2016 (K series layout)
6 time based over 3 tick based charts with DOM, T&S and a daily

New set up for trading the three horsemen...3 charts each for the NQ, YM and ES.
Each has a TIME based session chart with T&S over two TICK based T-Mode charts.
A daily chart on the upper right monitor is linked to the Quote Board.

06/24/2016 (Fp 4) Session and Daily over Tick
Very similar to the earlier Fp series layouts except the short term and long term charts
are arranged left to right...Dailies are on the top right with tick charts, DOM and T&S on the bottom.

06/28/2016

YM Daily, 15 Min, 5 Min, 1 Min, ES Daily and NQ Daily
over various sized Tick charts, a T&S and DOM.
The lower RH chart usually has the Trade Mode on-chart order placement tool enabled.

are minimized. Except for the daily charts, all windows are 'linked' to the
Quote Board for quickly changing the market being watched and/or traded.
06/20/2016 ONE MARKET (Fp 2)

06/04/2016


05/12/2016...
LH charts are linked to the Quote Board and are set-up for either the YM or NQ.
The RH charts are set-up exclusively for the ES.
YM or NQ Daily + long term Session ........................ES Daily + long term Session over
YM or NQ short term time based + mid term tick........ES mid term tick + short term time based
'Control panel' windows on the upper center monitor includes T&S, DOMs and the task bar.
Tick charts with Trade Mode are on the center lower monitor

04/14/2016...TWO MARKETS...
LH charts use black backgrounds, are linked to the Quote Board and are set-up for either the YM or NQ.
The RH charts have burgundy backgrounds and are set-up exclusively for the ES.
YM or NQ long term Session + Daily.............ES Daily + long term Session over
YM or NQ short term time based + tick charts....ES tick charts + short term time based

Added DOMs for each market

04/01/2016...THREE MARKETS...Time based over TICK


The four horsemen dailies on the left, 3 time based session charts over 3 tick based T-Mode

03/19/2016...4 Daily+3 Session+3 Tick (II)...minor changes to control panel windows.
 03/10/2016...All Markets Linked (4 Daily+2 Session+4 Tick)

The four horsemen dailies and full session time based on top over 1/2 session time based with 4 tick based T-Mode...

02/28/2016...All Markets Linked (1 D+3 Session+5T)


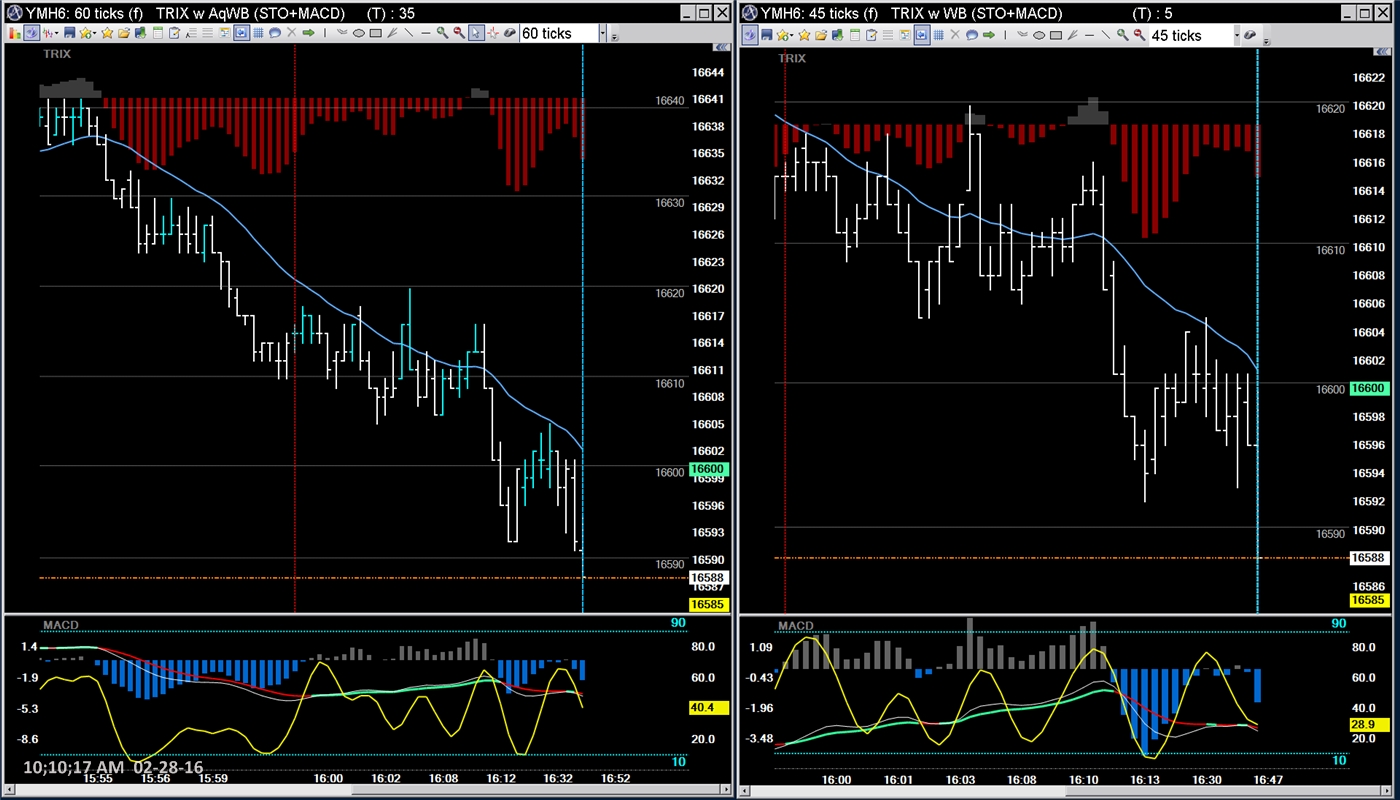


02/03/2016...ALL markets - Simpler, less cluttered
A pair of TIME based session charts on the left, colored four horsemen dailies over 2 sets of TICK based T-Mode charts.
Also saved an exact replica layout specifically for the faster paced ES...it's easier and faster to load
a complete workspace than to adjust each of the 4 T-mode templates.

02/07/2016


01/20/2016...ALL markets 6 Monitors
Same basic layout as last month's with
3 TIME based charts over 3 TICK based charts and 4 daily charts


12/03/2015...ALL markets 6 Monitors
6 intra-day charts linked to the Quote Board makes for 1 click switching between

I often use this layout in the morning, before the majors open when the pace is so much 'slower'
which makes watching 8 short term trade charts far less challenging vs. the MMO @ 9:30.
( 2 TICK charts each for the ES, NQ, YM and RUT).

During the main trading session I'll switch to a single market trade set up.
The "Control Panel" is on M 1 over Daily and Session candlestick charts...
These are linked to the Quote Board for switching between the four horsemen.


Condensed my entire set up to use "only" 6 monitors...added the extra 2 monitors to my old computer.
It now has 3 monitors and is used as my back up.
Moved the 'control panel' with the task bar to the upper left hand side, monitor 1. Across the top is a session chart (1 min to 4 hours)
next to daily charts of my 4 horsemen - RUT, NQ, YM and ES. I use the lower left hand monitor for Picture Viewer, Paint and browsers (etc.)
Then 2 mid-length tick T-Mode charts in the lower middle screen...My very short term entry T-Mode chart is on the lower right screen
that includes a DOM, T&S and the main APEX window containing Active Orders, Filled orders and other modules.
Monitor layout - Top Left...Top middle...Top right...Bottom left...Bottom middle...Bottom right


with Session and Daily charts linked to the Quote-board on the left.

9/15/2015
10 chart layout - - Minute based charts over tick based T-Mode with dailies on the right.
This is a great layout for focusing on the shorter term charts residing on the center monitors.
M1 over M4 .... M2 over M5 ..... M3 over M6
M1 ... M2 ... M3 ... M4 ... M5 ... M6

7 chart set up - - using just 4 monitors...basically a condensed version of the layout above
except the 4 daily charts have been "docked" together in the upper LH chart

9 chart 6 screen


09/04/2015
1/2 screen, 3 month daily charts of the ES, NQ, YM and RUT
over 3 candle charts based on minute bars next to T-Mode tick charts and a T&S.

08/08/2015...ANY market Alt 2 - showing all 8 monitors
Left hand monitors.....Daily charts with color coded histos of the ES, RUT, YM and NQ
Center left pair...........Full screen complete session over 3 minute and 1 minute charts
Center right pair................Filled orders+Quotes+Active orders, Linked daily chart plus
linked Depth of Market with linked Time & Sales over two T-Mode charts
Right hand monitors..........Picture Viewer over the Taskbar with Control panel windows


This one is the "keeper"

Zeroing in on the center 4 monitors - this set up helps with trading focus

a better perspective of price position when using the RH chart or the DOM for order entries.

Daily and session charts are paired on the left hand & center monitors...On the top right, (monitor 3) are the following windows:
Order history over Active orders, Completed orders over a Quote board plus a DOM and Time & Sales.
Bottom right on monitor 6 there are two tick T-Mode charts which are linked to the quote board for quickly switching markets.

Centered daily charts over trade charts for the ES and the NQ with session charts on the periphery.
This view is of 6 monitors... not shown are M4 & M8 , my "control panel" screens...Similar layouts are saved for the other markets

The daily and session chart pairs run across the top monitors...A browser and M/S Paint open on monitor 5...
A DOM, tick trade chart 1, Time & Sales, tick trade chart 2 with Trade Mode are on M-6 and M-7.
M-8 is for the vertical Taskbar with "control panel" windows including Task Manager, my PrintScreen folder and Speccy.

M-7 tick trade chart 2

M-8 "control panel"

07/17/2015...Any market
Daily and Session charts of the ES and RUT over the YM and NQ on the four left hand monitors.
Info window with linked DOM and Time&Sales over linked trade charts on the two right hand monitors.
Docking the color-coded Daily & Session charts makes it convenient to move the chart pairs in order to
line them up next to the generic-colored trade charts.

06/30/2015...3 markets
Session charts over trade charts with a linked daily chart over the "control panel" on the right hand screens.
Links to "contol panel" pictures...monitor 4...monitor 8
The three markets shown, from left to right are the Russell 2000, DJIA and S&P 500 e-mini futures

4 market layout...the charts on the right hand monitors are linked to the quote board on M8's control panel.

Tick chart pairs centered on six monitors with trade mode selected in the middle...
Linked Session+Daily charts over the "control panel" on the right hand pair of screens.

06/01/2015...2 mkt 6 tick charts
For viewing 2 markets at a time. Each trading pair has their own T&S, DOM and 3 tick charts...
Daily charts on the right hand monitors.
The ES over YM layout is pictured below. Similar layouts are saved for other combinations of symbols

05/21/2015...8 tick charts
For viewing two time frame trade charts in each of the four markets I trade.
This allows me to match differing ticks-per-bar for each symbol's chart set which are ID'ed by histogram color:
(NQ - green)...(YM - blue)... (ES - red)...(RUT - Olive) ... T-Mode can be quickly enabled on any or all of them.
The lower left monitor has 'generic' colored histos. A daily with a session chart are both linked to the quote board symbols.
The DOM and Time & Sales windows on the lower right monitor are also linked to the quote board.

My tendency is to focus more on the bottom monitors, especially the lower center while actively trading.
The times when I've decided to concentrate on the Russell emini, I'll open the layout shown above that has the
color coded RUT charts saved on the lower center screen...I have 3 additional layouts set up the same way except
that they have either the YM, the ES or the NQ on the bottom center monitor.
I find it quicker to load an entire layout when I decide to change the market I wish to focus on
rather than changing the symbols and settings for the bottom center charts.
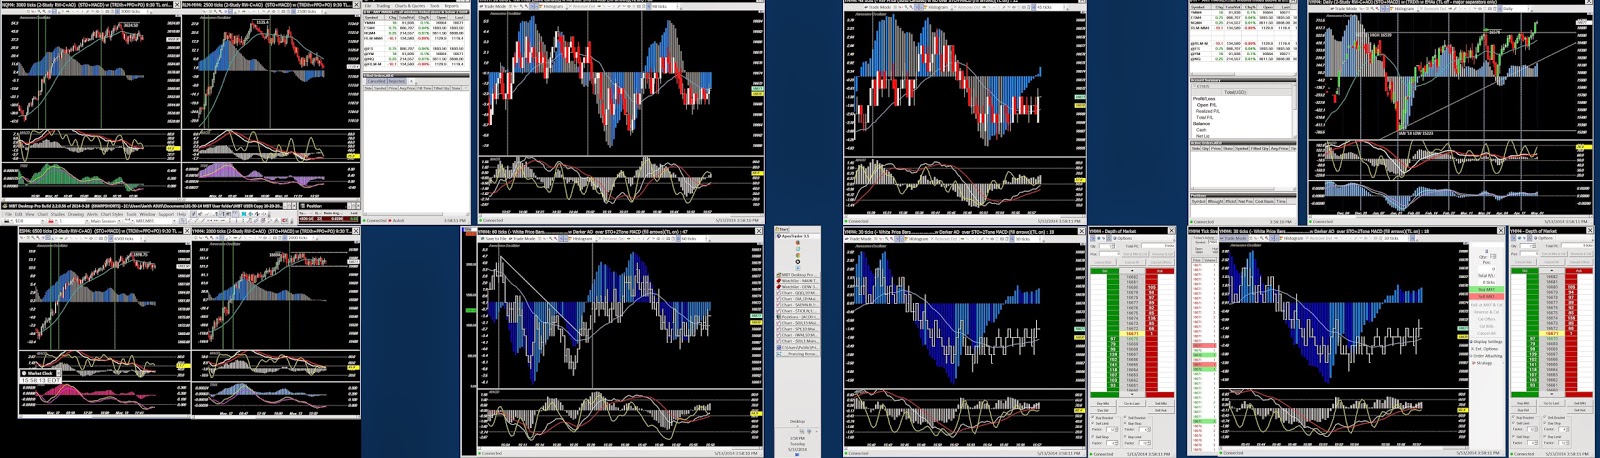
05/13/2015...4 markets with Linked charts
Main ApexTrader window over "linked" Daily & session on the left monitors.
2 tick charts with T-Mode for each market on the center and right monitors.

These next pictures show how the "linked" monitors and TICK chart monitors are set up.
Clicking any symbol in the Quote Board switches the T&S and the two longer term charts.


T-Mode

Each pair of T-Mode charts are set up as shown below.

05/02/2015...
6 Monitor Daily...Session...2 T-Mode

Monitor's set up


04/19/2015...
6 Monitor 2 market sets...ES over YM NQ or RUT

6 Monitor Session+Daily...Alt 5

6 Monitor Session+Daily...Alt 6


Across the top monitors - ES, RUT (with Active Orders) and NQ sessions...daily charts on the right.
Bottom - T&S, T-Mode,T-Mode with DOM and Session chart (all linked to the quote board)
The lower right monitor has the Task bar, YM daily and main Apex window.

The 4 monitors with two charts are set up for viewing session and daily charts of the ES, RUT, NQ and YM.
The two lower left monitors are the short term T-Mode charts which are linked to the quote board for quickly switching
between the four markets. I use the two right hand monitors for the taskbar and ancillery windows.


03/13/2015 Session + Daily over 3 T-Mode Alt 4
The 4 charts on the lower monitors are linked to the quote boards with the very ST to LT from left to right.
Moved the ApexTrader main menu windows to the left : Active Orders, Quote board, Filled Orders, Positions and Account Summary.
The individual chart configurations and monitor set ups are very similar to those posted on 3/11/2015.

Upper monitors are set up for the ES, the RUT and the NQ with 2 short term tick charts for each market.
The bottom monitors are set up for the YM with 3 short term tick charts and a daily.


The 2 lower LH T-Mode charts, the DOM and T&S are linked to the quote board.

03/04/2015 --2 Market - 3 T-Mode ALT 2
Placed larger T-Mode charts on the bottom monitors and linked them to the quote board. Session and daily charts are
on the upper monitors with Monitor 2's charts also linked. Other than the daily chart, all the linked charts have templates without TRIXh.
Monitor 3 usually displays the trade mode column and a template without a study pane. I've also detatched the drawing toolbar.


02/10/2015--ALL MARKETS ALT 6b
Shifted the ApexTrader main window to the lower right monitor and made that my primary screen...Resized the daily and session charts
Moved T-Mode charts to the right screens and placed the active order window under the DOM.

02/12/2015--2 MARKETS
2 sets of T-Mode on the LH monitors, 2 DOMs + 2 T&S with session charts on the center screens with dailies on the right.


01/14/2015--ALL MARKETS ALT 4
Slight changes - moved the ApexTrader main window to the lower screen.
One monitor for each market with a daily and session chart. This also allows for resizing either or both T-Mode chart widths...
Short term T-Mode through daily, right to left...The two left hand monitors (not shown) were left unchanged.

To see if I can pay more attention to the the longer term minute chart when it shares the screen with the mid term T-Mode.

01/09/2015 -- ALL MARKETS
Updated with new T-Mode chart templates on monitor 5...Utilizing the two left hand monitors for the wider Taskbar and miscellaneous windows.

12/30/2015 -- ALL MARKETS
Two T-Mode charts for the ES...un-docked Toolbars W/O Status Bars

12-19-2014 -- ALL MARKETS
Upper 3 monitors - Orders/Quotes/Positions/Balance and Lg Daily ES...Session/Daily YM... Session/Daily RUT
Lower 3 monitors - 240 Tick T-Mode over 3 min Session ES...480 Tick ES with DOM/T&S...Session/Daily NQ...
(link to individual monitor set up)

12-05-2014 -- 2 MARKET ES over RUT
Short term T-Mode through daily - right to left...I find it more comfortable to view the charts this way...

12-05-2014 -- 1 MARKET for RUT, YM or NQ
(also saved a separate layout for the ES)


12-03-2014 -- ANY MKT ALT 6 - 6 Monitor
I adapted some of the features from the previous ALT 6 ONE MARKET layout, added some new templates and consolidated it...
The Daily charts are on the 2 left screens with 3 longer term session charts over 3 T-Mode charts on the 4 right screens.
The tick sizes on the 6 right-hand charts work well for the YM, RUT and NQ but the ES requires its own layout.

ANY MKT ALT 6 - Right hand lower monitors, T-Mode charts with VOL-by-price histograms

12/04/14 Slight change - moved T&S next to the DOM

11-30-2014 --ALT 6 ONE MARKET
Layout Development and Changes made over 3 days...
Large multi time frames - saved a layout for each market...the ES is shown here.

An add'l T-Mode chart on the lower right

Modified the layout so that the T-Mode charts, which I watch more actively are still all on the lower screens.
Consolidated the account statistics - placed the window on monitor 5 with the Taskbar and the Printscreen folder.
Moved the two daily charts from monitor 1 to monitor 4 and replaced them with a multi-session tick chart.
It's linked to the quote board for quickly checking the other markets' price action throughout the day.
Moved the Time & Sales to monitor 3...Selected "Always on Top" for the Active Orders window and placed it on monitor 3.

Left monitors - Daily charts over Multi Day session...Right monitors - Full session and half session over T-Mode.
All longer term charts are candlestick while the T-Mode are white/green OHLC.
Back to using the DOM along with the Trade-Mode feature.

Rearranged ALT 9 to show left to right - Daily, Session, 3 T-Mode, T&S and Data windows.
I've saved three layouts - shown is the YM over RUT. The other two have the YM over the ES and YM over the NQ.
It's easier to switch layouts for the different markets than to adjust individual chart templates

11/24/2014 -- ALT 9 TWO MARKET
Rearranged Alt 8 - it's easier to compare multiple time frames for each market when they're inline.
It's also easier to compare one market to the other and the layout is a little 'cleaner'.
There are two sets of short term trade charts on the left and center monitors with longer term and/or dailies on the right monitors.
In this shot the Trade-Mode chart symbols are the YM over RUT...
Daily charts on the right show the YM & ES over the RUT & NQ.

ALT 9 TWO MARKET - Same as above with 5 time frames. I change the time frames on the left hand charts
that are on the right monitors a couple of times a day to reflect the entire major market open/close Price Action.
In this shot the symbols shown are the YM over RUT...

11/24/2014 -- ALT 8 TWO MARKET
Eliminated the DOMs - found they were more of a distraction than of any help.
Left hand monitors have three time frame Trade Charts, the dailies are on the right.

Set up with three T-Mode charts along the bottom with relatively short term time frames, 120T, 90T and 60T
from left to right along the bottom monitors...Also added new templates that highlight the slope
of the negative histograms, hopefully to point out divergences better. A 10 point grid is for getting a range "feel".
Rearranged the T&S and DOM windows to the lower left monitor, changed the colors and thickness
of the upper TRIX histo and added a "No Study" template to the middle right chart for zeroing in on price levels.


new thicker upper TRIXh and "No Study" templates applied


11/16/2014 - ANY MARKET ALT 5 - previous layout - a variation of ANY MARKET
11/10/2014 - ANY MARKET
Four larger minute based charts and four dailies on the RH monitors for the YM, ES, NQ and RUT. Two tick charts for trading share the botton L-center screen...one displays 'Trade Mode' most of the time. These two and the DOM are linked to the Quote boards for changing to different markets.
(11/12/2014 - I modified the layout for 6 monitors)
(11/12/2014 - Also added a two market layout)

These next two chart pairs show the time frames I typically use...
The first set has the Trade Mode charts - usually spanning less than a 1/2 hour to 1 hour of activity between the two.
The one on the left uses the the on-chart-trade-mode and the right hand uses the DOM for order entry.


10/07/2014 - All markets 8 monitor
Daily charts on the four outside monitors with trade charts on the inside four...The inside three charts on the lower monitors along with the DOM and T&S on the lower right hand monitor are linked to the quote windows for quickly changing the market...M2 & M3 are very short term trade charts with a longer term tick chart for showing the entire session or several sessions...M5 and M6 are set up that way as well

10/20/2014 - Variation of the above layout
Links to full screen images of what's displayed on each monitor:


09/10/2014 - ALL markets 6 monitor Alt 8 series
A new month brings yet another layout...this one is set up so that I can readily monitor each of the four markets I trade; the YM, ES, NQ and RLM...Around the perimeter there's a daily and an all session chart for each....The lower left and lower center monitors have the trade charts with one DOM and a T&S window.
The windows on these two monitors are all linked' to the quote boards for quickly changing the symbol...with only one click, each window will show what-ever market I wish to trade...no other adjustments need to be made except if I choose the ES. I use a much higher set of ticks-per-bar for the ES trade charts.

Depending on your browser set up , you may have to use their image zoom tool to increase or decrease its size
in order to see details of what each monitor contains - i.e. to read each chart's title bar for tick chart size, etc...
I use Google Chrome and increase zoom to 200% to get a full size picture with vertical and horizontal scroll wheels.

08/26/2014 - Two markets 6 monitor Alt 7 series
Another layout - trade charts on the LH side, session and daily on the RH side.
The same set up is on upper & lower monitors but with different markets.
I'm still running 8 monitors total...the two LH screens are not included in the tradestation layout shot - they are shown below.


I don't normally run so many browsers and other windows as are shown...
without them the CPU Usage is normally 10 to 32% and Physical Memory runs about 30%.

08/22/2014 - One market 6 monitor (SE)(CC) Alt 4 series
Each market has it's own saved layout...shown is the RLM layout...
3 longer term session charts are on the upper left screens - 3 shorter term trade charts are on the bottom left monitors.
Daily and/or session charts are in the RH monitors - 1 for each market.

the upper screen with Photo viewer over the taskbar and Printscreen folder on the lower screen.
(CC)%2BAlt%2B1%2Bseries%2BLH%2Bmonitors.jpg)
08/10/2014 - One market 6 monitor [9D1)g
4 trade charts on the bottom monitors linked to the Quote sheet for changing the market. Daily and session charts in the top monitors.
Not shown are the two left hand monitors with Photo viewer over the taskbar and Printscreen folder

Center left and right monitors for YM over RLM trade charts with YM+ES over RLM+NQ daily charts on the right monitors.
Not shown are the two left hand monitors with Photo viewer over the taskbar and Printscreen folder
d+6+monitor.JPG)
07/14/2014 - Two markets 6 monitor

07/12/2014 - Three markets 6 monitor

07/05/2014 - Two markets 6 monitor
Browsers & Windows Photo Viewer - Upper Left Monitor 1.
The Taskbar has been moved to the Lower Left Monitor 5.
Included are screenshots of each monitor's content.

Upper Left

Upper Left Center

Upper Right Center

Upper Right

Lower Left

Lower Left Center

Lower Right Center

Lower Right

06/22/2014 - Two markets 6 monitor
Another layout added to the list...I'm still running 8 monitors - the two left hand monitors are not shown.
I moved the Taskbar to the lower left monitor and use the upper left for browsers and Photo Viewer.
Link to full size picture

06/13/2014 - Two markets 8 monitor
The left hand pair of monitors have the four markets I follow (NQ, YM, ES and RLM). These are tick charts, usually set to show 1 or 2 sessions.
The other monitors have various sized tick charts with DOMs for trading. Here I'm displaying the YM over the RLM.

Above - Minor mods vs. the 05/28/2014 layout below...
I made the 2-study charts smaller on monitors 1 & 5 and removed their left hand scales.
Click here to view a full sized picture...It should open in a new window or tab
and it may take a few seconds to open as its a lot of pixels...Scroll up and down to study each monitor's set up...
05/28/2014 - Two markets 8 monitor

05/28/2014 - One market 8 monitor
Sometimes I'll focus on a single market using this 8 monitor layout...
This layout is very similar to the one above but much simpler to use. The upper monitors' charts show twice the tick size of the chart below it. Only 3 DOMs are used here.
There is much less clutter and fewer adjustments need to be made in order to see what I want to see on the charts.

05/13/2014 Alternative lll
The four charts (NQ, RLM over ES & YM) on the LH monitors 'share' the screens
over top of MBT's software (see the 2nd picture below).
The other six monitors display the same symbol and have 2, sometimes 3 different short term time frames
split between the upper & lowers... the upper right is nominally a daily chart.
All these windows are linked to the Quote sheet - one click instantaneously changes symbols in them all.
This embedded link should open a full sized picture of the layout in a new tab or a new window, depending on your browser...
You will need to scroll up/down - left/right to see which charts and open windows are displayed on each monitor...

05/01/2014 Alternative ll
Apex layout that can be used for any of the markets I trade.
The top monitors have daily charts and multi-session charts of the ES,YM,NQ and RLM.
The bottom monitors have all windows linked so that changing to a different market changes them automatically.
Added the Awesome Oscillator in place of TRIX in the price panes.
Also added Trade Order Arrows and turned off the Trade Lines except when using Trade Mode.
I discovered that different Bracket setting can be used/saved in the 2 DOMs and when using Trade Mode (RH bottom chart).

I still use MBT's software on the two left hand monitors for stocks, ETFs and options trading.
These monitors are not shown above but are still set up similarly to the 03/28/2014 layout included further below...
03/28/2014 All markets
8 monitors - two rows of four screens
Created another 4 new layouts for the ApexFutures layout list and hooked up the two monitors displaying MBT's software
to my main computer...this eliminated one computer and its peripherals from my trade station desk.
Below is the Apextrader layout for trading the RLM.
Multiple time frame charts for each of the 4 markets I trade with the bottom center and bottom right monitors set up for trading.
The other 3 new layouts are set up the same as this one except that the bottom sets of screens will display the ES, YM or NQ charts.

The MBT layout on the left hand set of monitors has changed a bit too.

Here's the layouts for the individual monitors in the trade station...
starting from the upper left hand side to the bottom right.
Each chart's symbol, time frame and template can be changed with either software package.


04/23/2014 Alternative
Very similar to the layout above but only 3 markets showing.
The longer term candle charts are still across the top monitors, but added two more shorter term single market bar charts on the bottom monitors.
The two left hand monitors (not shown) still have the MBT software running as described in the 3/28/2014 layout above.
.JPG)
03/10/2014 One Market Layout
6 monitors - two rows of three screens
Created 4 new layouts, one for each market I follow. Sometimes it's easier to concentrate
on just a single symbol and shut out most of the noise...This one is for the NQ - a mix of tick charts on the 1st two sets of screens
with minute based charts and a daily chart on the right set.

I still run 8 monitors occasionally - sometimes running MBT's software on my older computer which is set up for two monitors.
MBT is set up with some daily charts of selected major markets, two
watchlists including the DOW 30 and bull/bear ETFs.
A one minute DOW chart and one minute ADV/DEC line chart share the bottom monitor.

02/09/2014 Three Market Layout
6 monitors - two rows of three screens
Added DOMs for each market - Three charts for each market, each having different ticks-per-bar loaded plus each market's chart backgrounds and/or their histograms are color coded for quickly distinguishing between them at a glance....I can still use the TRADE MODE on-screen-order-entry on the screens with two charts
I created this layout because most of the time, I tend to concentrate my attention on the center bottom monitor ...plus I want to focus on the RUT

I've also created another layout for reviewing EOD and daily charts. Simpler and faster to change the layout than to load a whole set of templates for the daily continuous symbol charts - the continuous symbols also tend to cause some problems when loading them into my trading layout charts (above).
Plus the charts can be sized better to accommodate more data/bars and its easier to capture images for the links used on my DAILY LOG and NOTES page.

01/28/2014 Three Market Layout
Three charts for each market, each having different ticks-per-bar loaded plus each market's chart backgrounds and/or their histograms are color coded for quickly distinguishing between them at a glance....I use the TRADE MODE on-screen-order-entry on the bottom row of charts.
Here I have the (YM - ES - RLM) market layout. I have additional layouts saved for the (NQ - YM - RLM)...etc.
I'm displaying ApexTrader's software for the most part but I'm also got some of MBT's DesktopPro windows showing - the smaller YM chart on the left side of M1, a ADV/DEC chart 'sliver' on the right side of M2 and a Watchlist on the left side of M3.
I also have a few other MBT windows underneath the Apex windows. Having
Window's Taskbar on the upper/center monitor
makes it very convenient to switch between the two software packages or any other programs that are always open...

(YM - RLM - ES) layout...similar to the above showing MBT's main window on M1.

01/15/2014 Four Market Layout
8 monitors - two rows of four screens
Three charts for each market, each having different ticks-per-bar loaded plus each market's charts are color coded for quickly distinguishing between them at a glance....I can use the TRADE MODE on screen order entry on the charts with the black backgrounds or use the DOMs.
Since APEX has a 10 chart maximum, the YM and NQ share the charts and windows on M2+M6

(M1+M5) Left hand pair of screens for the ES

(M2+M5) Left center monitor pair for either the YM or the NQ

(M3+M7) Right center monitor pair for the RLM with Account summary, Active Orders and Position windows

(M4+M8) Right hand pair of monitors for Printscreen folder, Picture Viewer (and/or add'l windows)
with MBT's main window on M8 with NQ, YM and ES charts.

12/18/2013 Three Market Layout
Monitoring and trading 4 markets is a bit too much for me to handle on certain days, thus I've created a layout for 3. The upper monitors each have a single larger chart that I like to have showing part of the overnight session as well as the current major market session starting at 9:30...I adjust these a few time a day.
The lower three monitors each have 2 charts plus a T&S showing...'Trade Mode' for order entry is on each lower monitor's left side. Below the set up has the green NQ charts, purple RLM and blue YM.
(The MBT software is still set up on my right hand monitor pair which is not shown in the picture immediately below...scroll down for that set up)

01/06/2014

12/23/2013
9 chart-BARS-(3 T&S)(TICK based charts)..................Layout Alt 1
9 chart-CANDLES-(3 T&S)(TICK based charts)..........Layout Alt 2
9 chart-BARS-(3 T&S)(Minute based charts)................Layout Alt 3
9 chart-CANDLES-(3 T&S)(Minute based charts)........Layout Alt 4
I save the differing layouts that are listed above because it's easier and faster to change a layout than to adjust each of the 9 chart's properties. I'll sometimes load through these layouts as a way of adapting to changing market conditions...i.e. tweaking my 'feel' for what's working best for me on any particular day...(TICK)+(no+ES)+Alt+2+.PNG)
12/05/2013 Test Layout
To enable viewing and trading on any of the four markets I follow...
Often signals will be firing on multiple markets simultaneously or within a short period of time of each other. This layout was designed to enable taking advantage of these multiple market opportunities and/or to get an enhanced "feel" for timing entries...
We shall see if it helps or if it adds too much information to the trading process.
I have eliminated all the 'DOMs' and will use the 'Trade Mode' on chart ordering feature.
The picture below shows all 8 monitors - ApexTrader occupies the 3 left hand
pairs and MBT is on the 2 right hand pairs (blue charts)
ES - Red histograms, NQ - Green histograms, RLM - Purple histograms, YM - Blue histograms

12/13/2013 Added T&S windows and rearranged the chart order

11/27/2013 Other Layout Templates
Since it only takes a few seconds for Apex's software to change and load a new layout, I've saved several layouts for monitoring & trading different market pairs. This is faster and easier than changing the symbols for each Depth of Market, changing the chart symbols (for each market pair) and still having to deal with loading the differing chart templates...
This quick acting, layout loading feature is one I use quite often. The four smaller charts on the left side cover the four markets I monitor and trade - they are on each of the 9 layouts saved.
I'm still using 8 monitors (two rows of 4) with ApexTrader software occupying the 3 left hand monitors in each row (Picture 1)...I reserve the 2 right hand monitors to DesktopPro software (Picture 2). I consolidated this layout slightly compared to previous ones and added T&S windows next to each DOM. The two right hand charts in the center monitors are set up with "Always on Top" to cover the Trade Mode column on the charts next to them. This does not interfere with the Trade Mode's On Chart order system - just cleans up the look a bit...
Color coding the TRIX histos in the price panes and the MACD histos in the study panes helps identify which market is which...(YM=Blue, ES=Red, NQ=Lime, RLM=Purple). I'm constantly tweaking my layout and charts but the basic theme remains the same.
Picture 1...ApexTrader 6 monitors, ES and RLM layout
The dark blue screen area is for other, non-trading windows

Picture 2...MBT DesktopPro 2 monitors, to the right of the 6 shown above

Left Top (ApexTrader)

Center Top (ApexTrader)...ES trade charts

Right Top (ApexTrader)
The blue screen area is for other, non-trading windows


Center Bottom (ApexTrader)...RLM trade charts

Right Bottom (ApexTrader)...
The blue screen area is for other, non-trading windows

11/11/2013 Two DOM layouts
APEX and MBT (all 8 monitors)

11/07/2013 'Alt 4' Modifications
I find I spend most of my time focusing on the bottom set of monitors
so I have several layouts with each market's charts on the bottom monitors.
This one combines the RLM over the YM

This next layout is the same as the one above except that the NQ
is over the RLM.

The layout below has the ES over the RLM.

Saved Layout Templates for the differing combinations of the 4 markets I trade.

10/18/2013 Modifications
2 pictures - the first shows Apex on the 3 LH pairs of monitors...The right hand monitor pairs have miscellaneous charts and windows

Same layout as above except MBT's main window is brought to the front on the LH pair of monitors.

9/27/2013 Alt 4 'Trade Mode'
I'm finding it easier to focus on trading just two markets at a time rather than having trade charts for all four e-minis up all the time*.
In the price bar pane, I've color coded the TRIX histograms differently for each market which helps ID'ing the market at a glance...and since I use different tick sizes for each symbol's charts, saving a layout for each pair of markets saves me the task of loading new chart templates and tick sizes into the charts when I change markets.
ApexTrader takes only a few seconds to load different layouts, so switching back & forth between markets is quick and easy.

09/16/2013 Alt 3 'Trade Mode'
ApexTrader loads an entire layout faster than I can change a set of charts' symbols, their templates and reset their proper Tick sizes for the different markets I trade...
So I saved 3 new layouts - one for the YM & NQ, one for the YM & ES and another for the YM & RLM...(I may add additional symbol combinations later)... I sometimes prefer to view four markets (see Alt 2 below) and sometimes only two markets at a time - below I'm showing one of my two market setups - 4 RLM charts over 4 YM charts.

09/14/2013 Alt 2 'Trade Mode'... docked charts and DOM for each market

8/26/2013
Fewer trade charts - with MBT market monitoring on the left hand monitors

Alt 1 'Trade Mode' charts to the left of each trade chart

8/15/2013
Latest layout - fewer charts but more markets and 4 DOMs, each linked to a different market...Worked great today - fewer charts to distract me.
Various Tick charts are used on M1 (RLM), M2 (NQ), M5 (ES) and M6 (YM). Usually on M3 and M8 I show 5 minute charts covering the entire span of time that the major markets are open.
M4 and M8 are basically spares for my PrintScreen folder, Picture viewer, Paint and browsers...

8/05/2013
Got most of the bugs worked out of the 8 monitor system...yet another month and another new layout. After trading with ApexTrader's terrific software for several months now, I'm fazing out the MBT Desktop Pro software (using it just as a back-up...in case it may be needed).

7/09/2013
Another week, another layout modification...I moved my older 2 monitor computer into the office and am running my 'market feel' items using MBT DesktopPro. This adds room on my main 6 monitor trade station for monitoring two symbols using ApexTrader. I tend to focus on the 3 lower monitors more than the top 3 so that's where I've placed the trade charts and DOMs.

'Market feel' set up on 2 monitors on the older computer using MBT DesktopPro:

6/27/2013
MBT DesktopPro on M1 and M4 and ApexFutures ApexTrader on the rest.
M1 and M4 are my 'market feel' or strength of markets charts...the rest of the monitors are linked to the same market/symbol that I'm currently trading. I added a second order entry DOM to M5.

6/12/2013
MBT DesktopPro on M1 and M2 and ApexFutures ApexTrader on the rest.
Now using Stochastic TA (5,3,3 sma) in the study panes. Added TRIX histograms to the price panes of the trade charts on M5 and M6.

5/30/2013...

4/28/2013...
Combined MBT and Apex layout - both software packages are excellent as far as chart adjustment capabilities and available features...hard to choose which I like better so I'm running both.

04/16/2013 Apex 6 Monitor Layout

04/11/2013 Added ApexTrader Software
So far I like Apex's platform - their charts, market quotes and DOM (Depth of Market) order entry are very well designed...I am still using MBT's DesktopPro platform as well.
 |
03/06/2013...Back to 6 Monitors
Went back to six monitors after too many issues with the eight monitor set up. Besides the technical problems with the computer, I found that 8 monitors was just too much - too many charts and windows to focus on...keep it simple works for me. I'm also using TICK charts rather than minute charts.

02/20/2013...Added 2 more Market Ladders

02/25/2013 Futures Layout

02/16/2013...8 Monitor Set Up

01/20/2013...Added Blue B/G charts

12/15/2012 MBT 6 Monitor set up

Monitor 1-A
The main MBT window with a daily chart and Watchlists.

Monitor 1-B...showing M 1-A restored down

M 2

M 3

M 4

M 5

M 6
